Business KPI reports
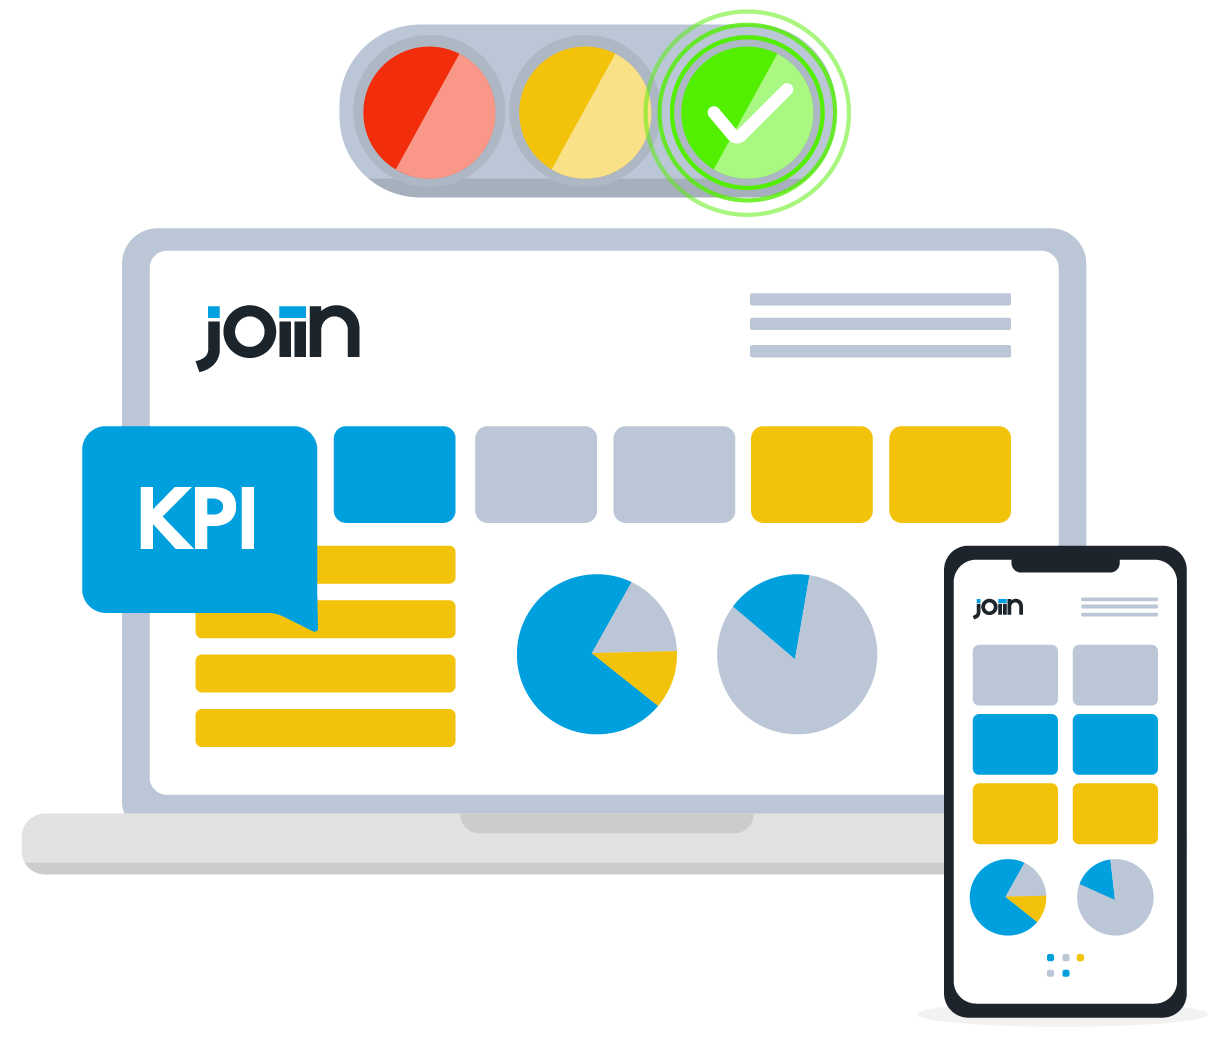
Identify how well your group performs with Joiin’s dashboard view and KPI reports, containing all of the critical data and performance indicators you’ll need.

“What took me hours in Excel I can now do in seconds with Joiin”
Key finance metrics at a glance
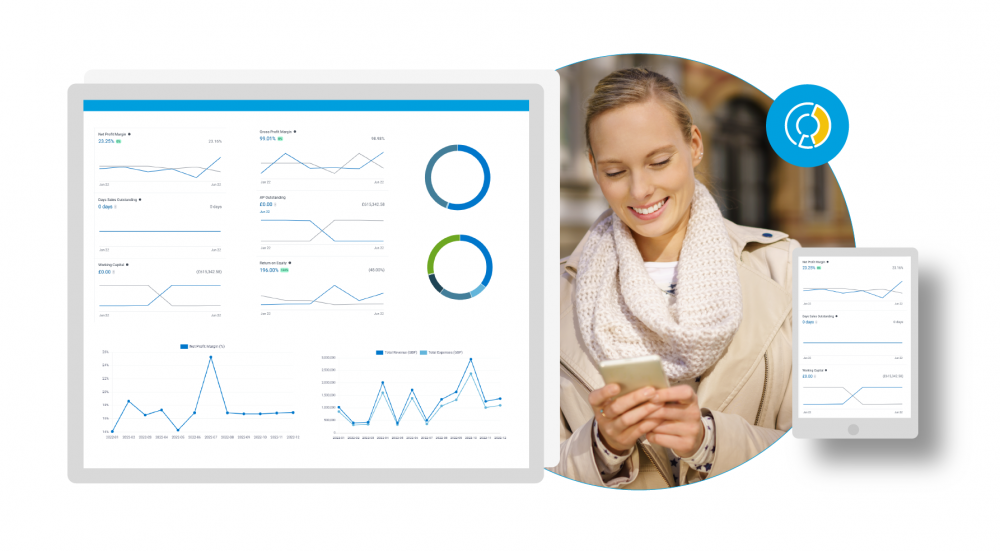
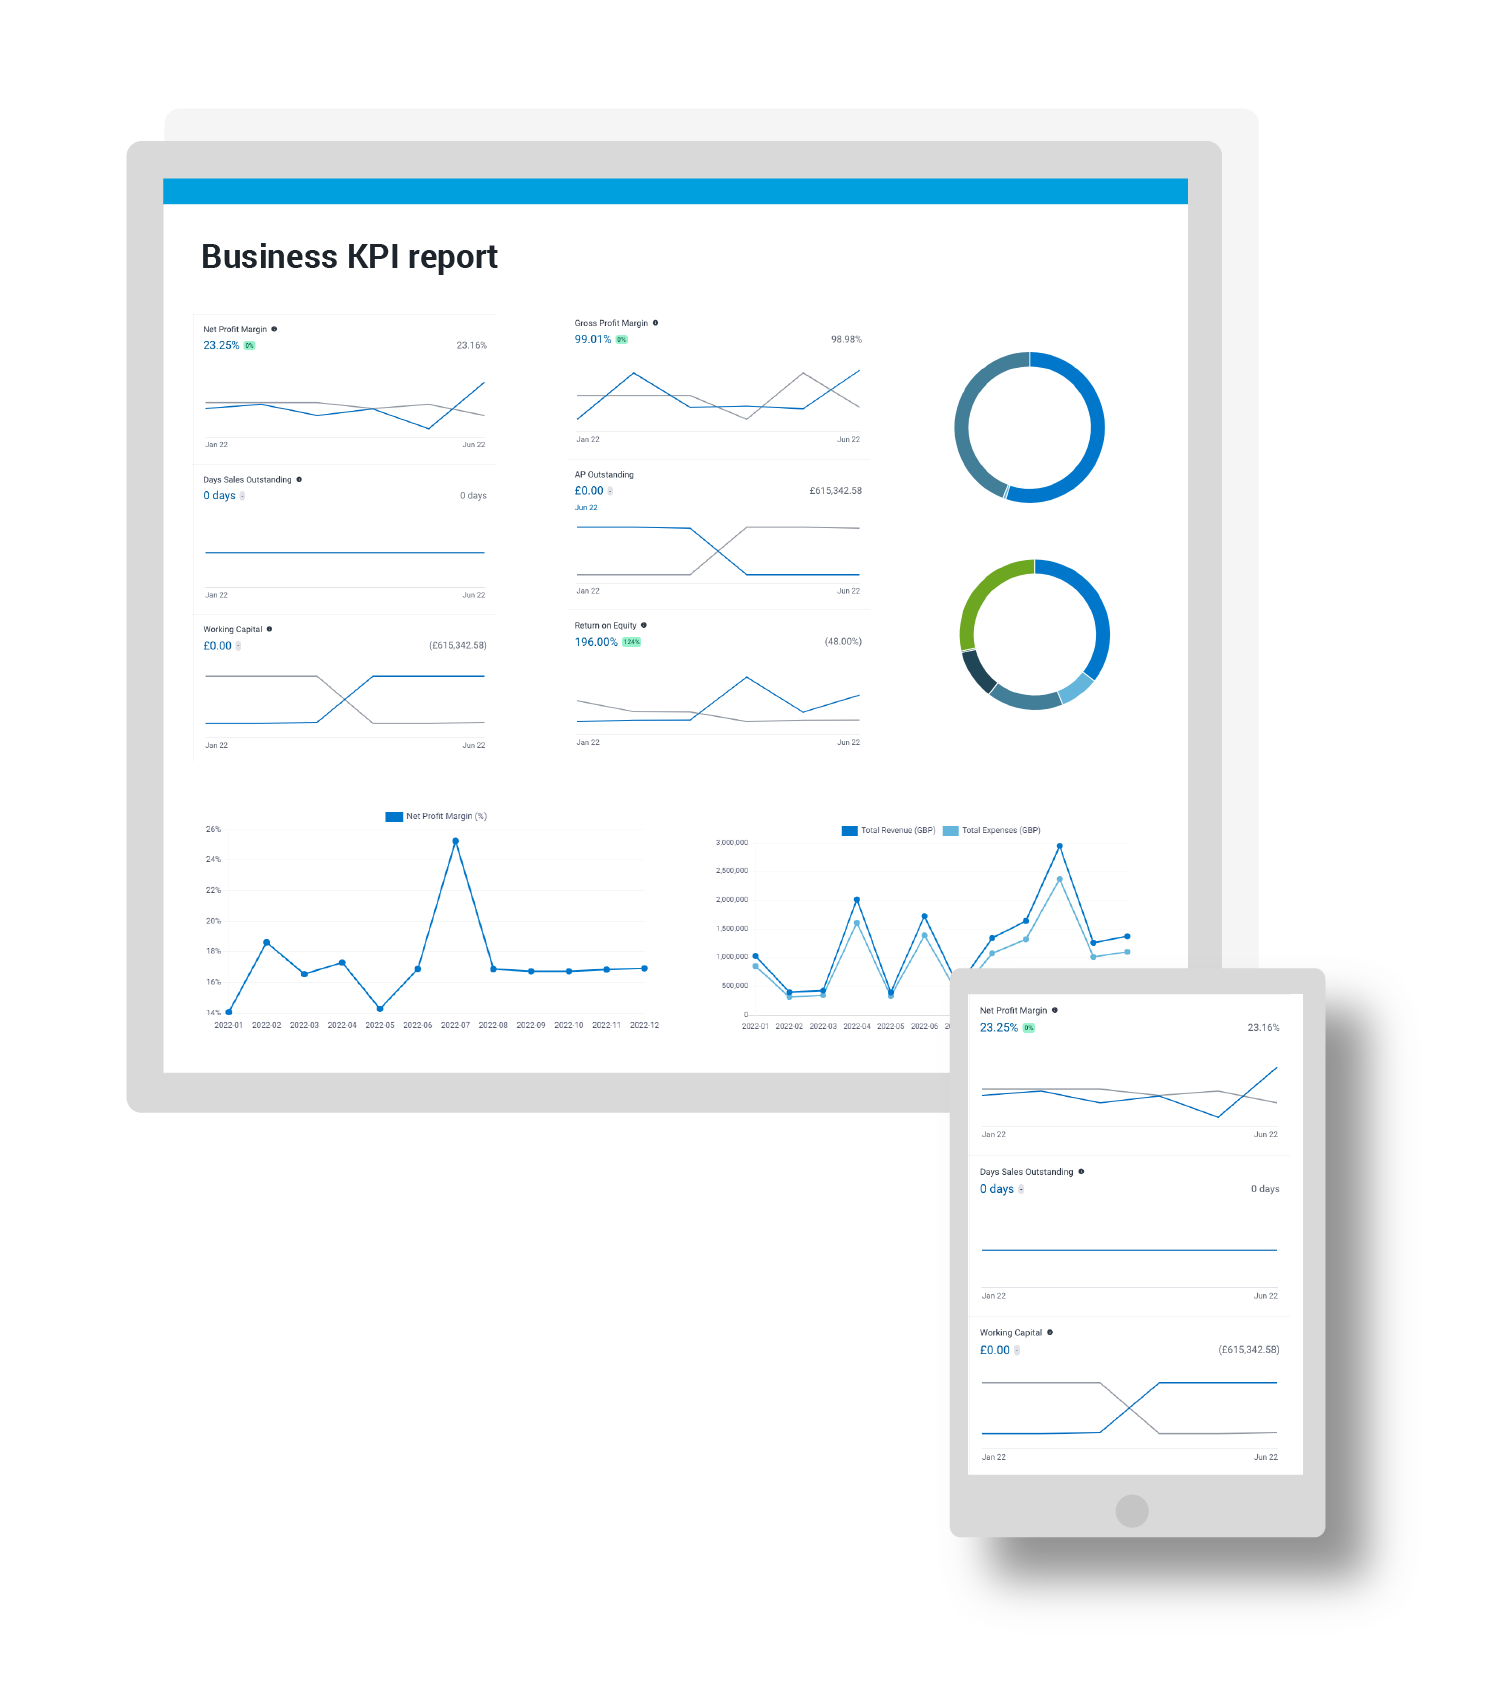
Need to grasp that day’s highlights and make sense of your numbers at a glance? Our Joiin dashboard gives you a highly-visual one-page financial overview, meaning you can easily stay up to date with the metrics that matter most to you. Pictured below, data is presented visually in charts and graphs that are easy on the eye, providing a way to easily monitor finances and stay up-to-the-minute when it comes to business performance.

Consolidated KPI reports
Our KPI reports contain 10 critical KPIs and are fully customisable and compatible with our Report packs. Below we’ve described each reportable KPI, so you can decide what’s required for your reporting needs.
Total Revenue – total receipts of a company for a given period from all sources of a company’s income.
Total Expenses – total of all expenses that appear on the P&L report or income statement.
Gross Profit Margin – gross profit margin looks at cost of goods sold as a percentage of sales. With this report you can see how well a company controls the cost of its inventory against the costs passed on to its customers – the larger the gross profit margin, the better for the company.
Operating Profit Margin – profit after the company’s operating and running costs have been deducted from the total revenue. It is used as a measure of a company’s ability to be profitable.
Net Profit Margin – sometimes known as the net margin or bottom line is the percentage of revenue remaining after operating expenses have been deducted and is used to show profit as a percentage per dollar/pound/euro.

Return on Equity – ROE measures the profitability of a business in relation to its net assets. This report is used to measure how well a company is using its investments.
Activity Radio – measures a company’s ability to convert different accounts within its balance sheets into cash or sales. This helps to determine the efficiency of a company’s ability to generate revenues and cash from its resources, based on the use of its balance sheet items.
Day Sales Outstanding – also known as DSO and Days Receivables, this is a calculation used by a company to estimate its average collection period.
Working Capital – a basic measure of liquidity showing the ability of a company to meet its current financial obligations.
Net Working Capital to Total Assets – this ratio compares total current assets and total assets to determine a company’s ability to meet its short-term financial obligations. Joiin has a number of reports, grouped into two main categories: key financial reports and business performance reports.
FAQs regarding KPI & dashboard reporting
How does Joiin simplify the process of sharing financial reports?
It’s easy to share reports with colleagues, clients or stakeholders – export reports in various formats such as PDF or Excel, or share them directly through secure links at the touch of a button.
Can I create and customise financial reports to my individual business needs?
Choose your own customisation options for financial reports and tailor your information to meet your specific business requirements by selecting the desired metrics, time periods, and visual representations. This flexibility ensures that your financial reports align precisely with your analytical needs.
Simply tailor your reports to focus on specific metrics, time periods, or business segments, giving you the most up to date and actionable information for your organisation.
How does Joiin simplify the budget vs. actuals analysis in financial reporting?
Joiin makes budget vs. actual analysis seamless by allowing you to compare your budgeted figures with actual financial results in real-time. Easily track variances, identify areas of improvement, and refine your financial strategies based on accurate and up-to-date information.
Can I use Joiin's KPI reporting features to analyse trends and make strategic financial decisions?
Our KPI features offer powerful analytical tools to help you identify trends, track performance over time, and make informed strategic decisions.
Whether you’re analysing revenue growth, expense trends, or profitability, Join’s KPI reports give you the insights needed for effective financial planning and decision-making.
Can Joiin help me generate consolidated financial reports for multiple entities or departments?
It’s what we do best! Whether you have multiple entities or departments, you can effortlessly combine financial data into consolidated reports. This allows you to streamline the reporting process and see a holistic view of your organisation’s financial health.
What key financial report features does Joiin offer to enhance my financial analysis?
Joiin provides a range of powerful financial reporting features, including customisable profit and loss statements, balance sheets, cash flow reports, KPI reports, sales reporting and our newest addition, Global Search. These reports offer in-depth insights into your financial performance, empowering you to make informed decisions for your business.
How can I customise my Dashboard in Joiin to suit my specific business needs?
The Dashboard feature allows for full customisation to meet your unique business requirements. To tailor your dashboard, simply navigate to the settings section within Joiin and choose the widgets that best represent your key financial metrics.
Whether it’s revenue, expenses, or profit margins, you can arrange and display the information that matters most to you.
Can I share my Joiin Dashboard with other team members or stakeholders?
We believe in making collaboration as easy as possible by enabling you to share your Dashboard with team members or stakeholders in the office or on the go.
Simply select the sharing options within the Dashboard settings and invite others to view or collaborate on the financial insights, you can even choose how much access to allow, meaning you can be sure that everyone is on the same page.
How frequently is the information on the Joiin Dashboard updated?
The Joiin Dashboard provides real-time data updates at the touch of a button, so you can be sure that you have access to the most current financial information whenever you need it.
Can I track the performance of multiple entities simultaneously on the Joiin Dashboard?
Yes, you can. The Dashboard feature is designed to support multi-entity tracking.
Set up different widgets for each entity to monitor their performance side by side. This capability is particularly beneficial for businesses with diverse operations, offering a consolidated view of financial data in one central location.
How does the Joiin Dashboard improve my financial visibility and analysis?
Our newly upgraded Dashboard is a powerful tool for enhancing financial visibility and analysis, giving you a visual representation of key financial metrics and making it easier to identify trends, patterns, and areas that may require attention.
With customisable widgets, you can focus on specific aspects of your business, enabling data-driven decision-making in real-time.
Start reporting KPIs today
Looking for something specific?
Explore our Support area, or feel free to drop us a line


