Making sense of these unsettling economic times
We’re living through an unsettling economic period, summarised in one of KPMG’s more recent Global Economic Outlook reports, which best describes today’s world as turbulent and uncertain with constant challenges and threats.
Yet, KPMG’s latest CEO Outlook provides optimism. It surveyed 1,325 global CEOs on their three-year outlook on the business and economic landscapes, finding CEOs are “confident in their companies’ resilience and relatively optimistic in their own growth prospects”.
KPMG’s CEO Outlook notes it’s unsurprising that the economic climate is now a top concern for business leaders. But these same people have “learned to navigate the unpredictable, realigning their workforces, untangling supply chain disruptions, and adapting to geopolitical and economic impacts.” With more unsettling times ahead, the report says that many are already prepared with a deep focus on planning and agility. Technology presents opportunities.
So how can you reassure and advise – and help your business or your practice’s clients achieve financial resilience and sustainable growth – and ease their adaptation to these new times? What technological solutions can you recommend?
Having a readily available suite of digital reporting could be your answer.
Digital reporting tools
Modern accountancy platforms can generate dynamic, robust real-time reporting to help you and your clients navigate the most difficult times. Particularly true if you’re managing finances across multi-entity groups and global regions and navigating multiple business threats and challenges.
A legacy of Covid, undoubtedly one of the biggest challenges we’ve all experienced recently, is that shifting an organisation to a digital-first mindset is a top priority for 77% of business leaders, according to the Advanced Annual Trends Survey 2021.
KPMG’s CEO Outlook found that CEOs continue to prioritise digital investment – with 72 per cent agreeing they have an aggressive digital investment strategy.
Digital transformation a reality
Adopting new digital tools is a must. And because new tools see data as a dynamic asset – and not statically confined to spreadsheet fields – digital reporting is one of the most powerful assets you can have.
At Joiin, we work closely with accountants and advisors with clients requiring powerful reporting, such as business owners, entrepreneurs, investors, and collaborators who must consolidate and report on finances across several companies. These might be across business portfolios, family offices or global operations in multiple countries.
In this blog series, we explore five types of digital reporting that are already driving critical insights into the health of businesses, identifying risks and opportunities, and helping to build a more robust financial narrative.
First up, at-a-glance dashboards.
“Digital transformation is now a reality. Adopting new digital tools is a must. And because new tools see data as a dynamic asset – and not statically confined to spreadsheet fields – digital reporting is one of the most powerful assets you can have.”
Reporting #1: At-a-glance dashboards
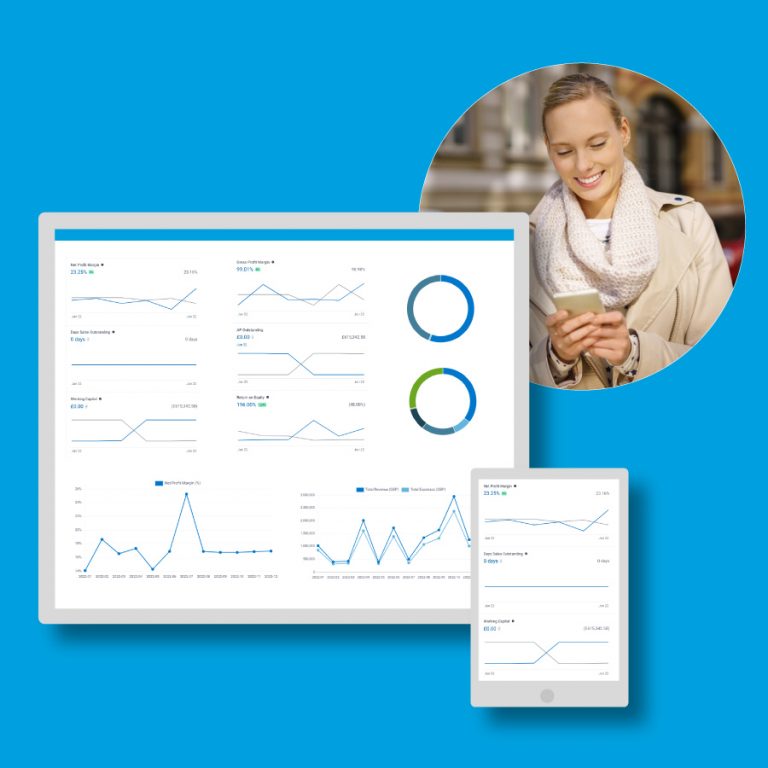
Dynamic data is no more apparent than in a real-time dashboard.
During times like these, even if the economy rapidly shifts on the daily, an on-screen dashboard lets you quickly grasp that day’s highlights, instantly make sense of your KPIs and track progress there and then. With data brought together on one screen, you can see patterns more easily, improving decision-making and enabling rapid adjustments.
If you’re working with a consolidated portfolio, you get a clearer real-time picture of performance across all business entities, with key numbers like operating profit margins, cash in the bank, and total revenues.
How our Joiin platform can help
Joiin’s KPI dashboard (pictured above) delivers a highly visual one-page financial overview in charts and graphs that are easy on the eye.
It looks great on mobile and desktop, meaning you can easily monitor finances and business performance and stay updated with the metrics that matter most to you, wherever you are.
A Joiin dashboard can be created for one entity (if you want to monitor a specific company) or multiple entities for more complex group reporting.
About this blog series
This blog series explores five essential digital reporting types for accountants that can help make sense of these unsettling economic times. Reporting that’s proven to drive critical insights into the health of a business, identifying risks and opportunities, and helping to build a more robust financial narrative.